Managing start waves for mass running events (Lap2go)
In June 2018, myself and good friend/fellow DPhil student Florian visited Barreiro, Portugal, for the 140th European Study Group with Industry (ESGI140). Depsite attending a number of similar study groups, I think the project we undertook at this one was my favourite, so I want to elaborate here.
For those who don’t know, a study group with industry is a one week workshop, where industry partners present challenges they’re facing, and mathematicians work together in an attempt to make progress. Despite the short time-frame, these workshops are often incredibly fruitful for both groups. I would highly reccomend any junior applied mathematicians or statasticians attend at least one of these workshops if given the chance.
For ESGI140, we chose to work on a challenge presented by Lap2Go, a Portugese company that manages large racing events. Our choice was somewhat limited by the fact that this was the only challenge presented in English; however, we were fortunate as this was a really fun problem to work on. Lap2Go wanted to know how they could better manage the waves of runners at the start lines to (i) reduce overall event time and (ii) reduce time-lost through distruption for the runners. For objective (i), the longer the race lasts, the greater the event costs to run. For objective (ii), runners (customers) will be disatisfied if they are constantly waiting in human traffic jams at chokepoints, unable to run their own race. These two objectives may be at odds: putting the slower, rate-limiting runners closer to the front may reduce the overall event time but cause huge pile ups behind at chokepoints. Through discussion with Lap2Go we realised that objective (ii) was the primary goal, but that objective (i) would still ensure sensible wave separation.
Problem statement
The most important part of any short-term industrial collaboration is the start: problem formulation. This means having a clear idea from the industrial partner what would be useful to them, what resources they can provide, deciding on a concrete plan for the duration of the work, and deciding on what will be delivered at the end of that period. Communication is key!
For this project, Lap2Go could provide chip timing data for a real race; that is, each runner in the race wore a small chip that recorded the time that runner passed by a each checkpoint. As the project evolved, and some feasibility analysis was conducted, we realised that Lap2Go could also provide course width and elevation data for that course. We should have probed more at the outset of the work to know this data was available, but in the end there was no harm done receiving it when we did.
Given this data and the goals of the project we formulated a target for that week: Determine if allocating the runners differently into each of waves could have reduced the time each runner lost through traffic jams.
Our approach
We built an agent-based runner model to tackle this problem, from which we could simulate entire races for different runner–wave allocations. Then we simulated the event for different configurations and determined the wave optimal allocation. The modelling pipeline was as follows:
- Data cleaning Exploring the chip data we identified a number of physically impossible runs. As a heuristic, anyone who completed the 10km race in less than world record time was excluded from the data. Knowing the distance between checkpoints allowed us to convert these chip times into average running speeds for each runner.
- Training agent-based model We used the distribution of runner speeds to calibrate our agent-based model. We found the distribution of runner speeds differed based on which wave the runner was in: wave 1 runners were the fastest on average, and wave 3 the slowest. We incorporated runner disruption into the agent-based model based on the density of runners nearby—too many people and the runner must slow down—and elevation gradient—up hill the runners were slower.
- Forward simulation We (here Florian deserves most of the credit) built a hybrid python–c++ race simulator. From the output of this simulation we can (a) visualise the event and (b) compute time lost per runner.
- Optimisation With a mechanism for computing loss, we can now perform a sweep over the input parameters and determine optimal configurations. There is obviously more direct ways to do this, but for illustrating the results to Lap2Go it was useful to see the entire loss surface, and where the actual race parameters were relative to the optimum.
Findings
This project turned out to be a success: we overdelivered compared to the original problem formulation and the industry partner was happy with our analysis.
Illustrated below (Fig. 1) is a simulation for the configuration used for the actual event. Each point is a runner, and the point’s colour reflects the runners speed. The key thing to look out for is how the colour of the points change near choke-points of if that runner gets nearer to a collection of other runners. This visualisation provides us with some useful intuition, and we immediately see that if there’s a narrowing of the course near the start of the race, we have to be careful about how close successive waves are released.
In Fig. 2 we illustrate the average time lost per runner for different wave sizes (keeping the gap between waves fixed). The red cross illustrates the configuration used for the actual race, and the light blue region towards the centre illustrates configurations with less disruptions per runner. In this case the real configuration was sub-optimal, but not horrible; that is, it could have been considerably worse. For the configuration used in practice we predict that the average runners time was around 100s slower because of disrutption, but if the configuration was optimised this woudl drop to around 80s per runner.
This preliminary work showed what is feasible given track data and estimates of runner behaviour. In an extended study we could optimise over the wave sizes, the time beween waves, and the overall event time. Furthermore, the loss function used could be improved to factor in that some runners (the faster runners) care more about disruption than others. Overall, this study did what it was supposed to, it demonstrated that it is possible to improve events by better scheduling waves.
Fig.1 A simulated race using the actual event conditions and release strategy. The points are individual runners, and the points colour reflects their speed. The course width and elevation are based of real data.
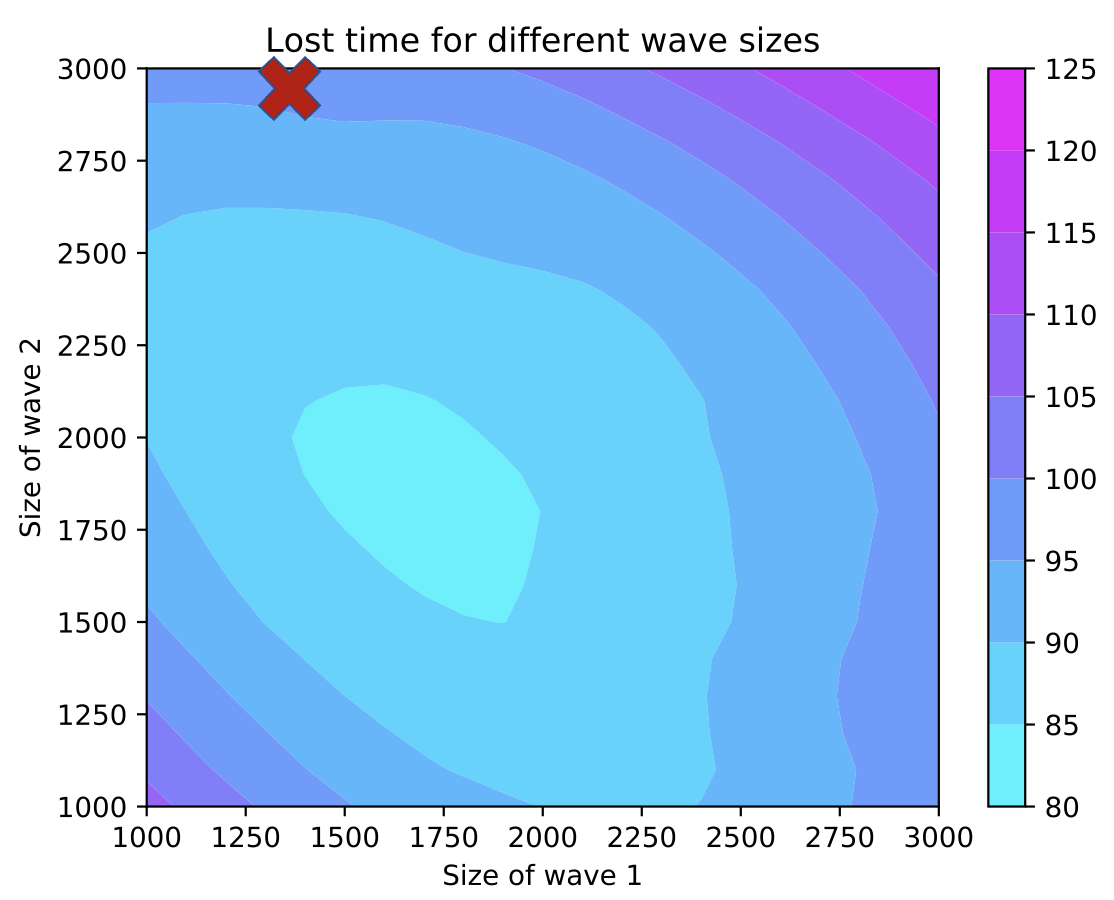
Fig.2 The loss surface representing the time-lost through disruption for each runner for different release strategies. The light blue region near the centre indicates the optimal configuration, and the red cross indicates the strategy used on the day of the race.